How to Analyze TikTok Content Performance
You hit publish on your latest TikTok, cross your fingers, and hope the algorithm blesses you. When a video takes off, it feels like magic - but when one flops, it’s a total mystery. This article cuts through the guesswork. You'll learn how to use TikTok's built-in analytics to understand what’s working, what isn't, and how to create more content your audience - and the algorithm - absolutely loves.
Why Your TikTok Analytics Matter More Than You Think
Diving into your analytics might not feel as creative as filming your next video, but it’s one of the most strategic things you can do. Analyzing your performance is about understanding the “why” behind your results. It's direct feedback on what your audience finds entertaining, useful, or share-worthy.
Here’s what you gain by looking at the data:
- Understand the Algorithm: The TikTok algorithm rewards content that keeps users on the app. By identifying which of your videos have the best watch time and engagement, you find the blueprint for what the algorithm wants to promote.
- Know Your Audience: Analytics go beyond follower count, showing you where your viewers are located, when they’re most active, and which topics truly grab their attention.
- Justify Your Effort: For businesses and marketers, data is essential for proving ROI. Analytics help you connect your content efforts to tangible goals like website traffic, leads, and brand awareness.
Accessing Your TikTok Analytics Dashboard
Before you can analyze your performance, you need to know where to find your data. You'll need a Business or Creator account to access the full analytics suite. Switching is free and simple. Once you have that set up, here’s how to get to your dashboard:
- Go to your Profile page in the TikTok app.
- Tap the hamburger menu (three horizontal lines) in the top-right corner.
- Select Creator Tools or Business Suite.
- Tap on Analytics.
The analytics are broken into four tabs: Overview, Content, Followers, and LIVE. For content performance, you'll spend most of your time in the Content tab.
The TikTok Metrics That Actually Move the Needle
Once you’re in your dashboard, you'll see dozens of different metrics. It's easy to get overwhelmed, but only a handful are truly critical for understanding content performance. Let’s break them down into what they are and why they matter.
Discovery & Reach Metrics
These metrics tell you how many people are seeing your content and where they're finding it.
- Video Views: The total number of times your video has been viewed. While a high view count feels great, it's just the tip of the iceberg. It doesn't tell you if people actually watched or cared. Look at it as a starting point.
- Reach: The number of unique users who saw your video. This gives you a better idea of your true audience size for a specific piece of content.
- Traffic Source (For You Page %): This is a crucial one. Find this by tapping on any individual video's analytics. It shows you the percentage of your views that came from the For You Page (FYP). A high percentage (ideally 50%+) means your content is being pushed to new audiences by the algorithm.
Engagement Metrics
Engagement metrics show you how people are actively interacting with your video. These are strong positive signals to the algorithm.
- Likes, Comments & Shares: These are the classic engagement trio. A "Like" is a simple nod of approval. A "Comment" shows a deeper level of engagement and community building. A "Share" is the most powerful of the three, as it shows someone values your video enough to vouch for it with their own network.
- Saves (Favorites): Think of a "Save" as a super-like. When a viewer saves your video to their favorites, they're signaling that your content is so valuable they want to easily find it again later. The algorithm loves this. Educational, aspirational, or useful content tends to get high save rates.
The Holy Grail: Audience Retention Metrics
If you're only going to focus on one category of metrics, make it this one. TikTok's primary goal is to keep users on the app longer. Videos with high audience retention are its secret weapon, and it promotes them heavily.
- Average Watch Time: This is arguably the most important metric on TikTok. It shows you, on average, how long people watched your video. If you have a 30-second video with a 25-second average watch time, you have an absolute winner. This tells the algorithm that your content is fascinating and successful at holding attention.
- Watched Full Video (%): This is the percentage of viewers who made it all the way to the end. A high completion rate is a massive signal that your video is compelling from start to finish. Losing a lot of viewers in the first 3 seconds? Your hook needs work. Do they drop off halfway through? Your content might be dragging in the middle.
Business & Conversion Metrics
For brands and businesses, TikTok content needs to contribute to larger goals. While native conversion tracking can be limited, you can still measure its impact.
- Link in Bio Clicks: Your profile is the main place to drive traffic off-platform. Under the "Overview" tab in your analytics, you can track "Profile Views." Spikes in profile views after posting a video with a verbal call-to-action (like "check the link in our bio to learn more") can indicate content-driven interest. If you have over 1,000 followers, you can add a clickable link to your bio and track its performance using UTM parameters or a link shortener like Bitly.
- Attributing Off-Platform Conversions: Don't forget to connect the dots manually. Did you mention a specific discount code in a TikTok video? Track how many times that code was used on your Shopify store. This creates a direct link between a piece of content and revenue.
A Simple Framework for Consistent Content Improvement
Collecting data is easy. Turning it into better content requires a system. Here is a simple, four-step process you can use every week to analyze your performance and make smarter decisions.
Step 1: Categorize Your Content
Trying to compare the performance of a comedy skit against a product tutorial is like comparing apples and oranges. Create 3-5 content "pillars" or themes that you consistently create. Here are some examples:
- For an e-commerce brand: Product demos, behind-the-scenes, user-generated content, trending sound videos.
- For a SaaS company: Educational short-form tutorials, industry news breakdowns, customer testimonials, team culture posts.
Step 2: Start a Simple Reporting Habit
You don't need a complex dashboard to get started. Often, the process looks like exporting your data to a CSV every week and pulling it into a simple spreadsheet, like Google Sheets or Excel. Track the key metrics for each video and tag it with its content pillar. While manual, this ritual forces you to look at the numbers and spot trends.
Step 3: Compare Performance Across Pillars
Once you have a few weeks of data, you can answer important questions. Do your "Behind-the-Scenes" videos get more saves but fewer views than your "Trending Sound" videos? Do your "Product Demos" have a much higher average watch time? This helps you understand what type of content resonates for different goals (e.g., watch time vs. new follower growth) and where you should invest more of your time.
Step 4: Use the "What, So What, Now What?" Model
This is an analytical framework to turn your data into action. For your top and bottom-performing videos each week, ask yourself:
- What? State the objective fact from the data. (e.g., "Our last 'Product Demo' video only had an average watch time of 8 seconds on a 60-second video.")
- So What? Interpret what that fact means. (e.g., "This means viewers found the video immediately uninteresting or confusing.")
- Now What? Delineate a specific action you will take next. (e.g., "Next week, we'll test a 15-second product demo focused on a single 'wow' feature with a much stronger visual hook in the first 2 seconds.")
Level Up: Advanced TikTok Analysis Techniques
Once you've mastered the basics, you can apply a more qualitative lens to your analysis.
Study Your Breakout Videos
Pull up your top 5-10 videos of all time. Don't just look at the stats - watch them again. What do they have in common? Was it the hook? The music? The editing style? The length? The call-to-action? Look for a pattern in your success that you can replicate.
Listen to the Comments Section
Your comments section is a goldmine of audience feedback. It’s not just a number on a dashboard. Read them. Are people asking clarifying questions? Tagging their friends? Sharing related experiences? This qualitative data gives color and context to the quantitative numbers.
Correlate Post Time with Follower Activity
In the "Followers" tab of your analytics, you'll find a panel showing when your followers are most active. Compare this with the posting times of your most successful videos. You may discover that posting just before your audience's peak activity time gives your content an initial velocity boost that helps it get picked up by the FYP.
Final Thoughts
Analyzing your TikTok performance moves you from creating content based on gut feelings to making strategic decisions backed by data. It's the most reliable way to build a systematic process for understanding your audience, satisfying the algorithm, and consistently growing your account.
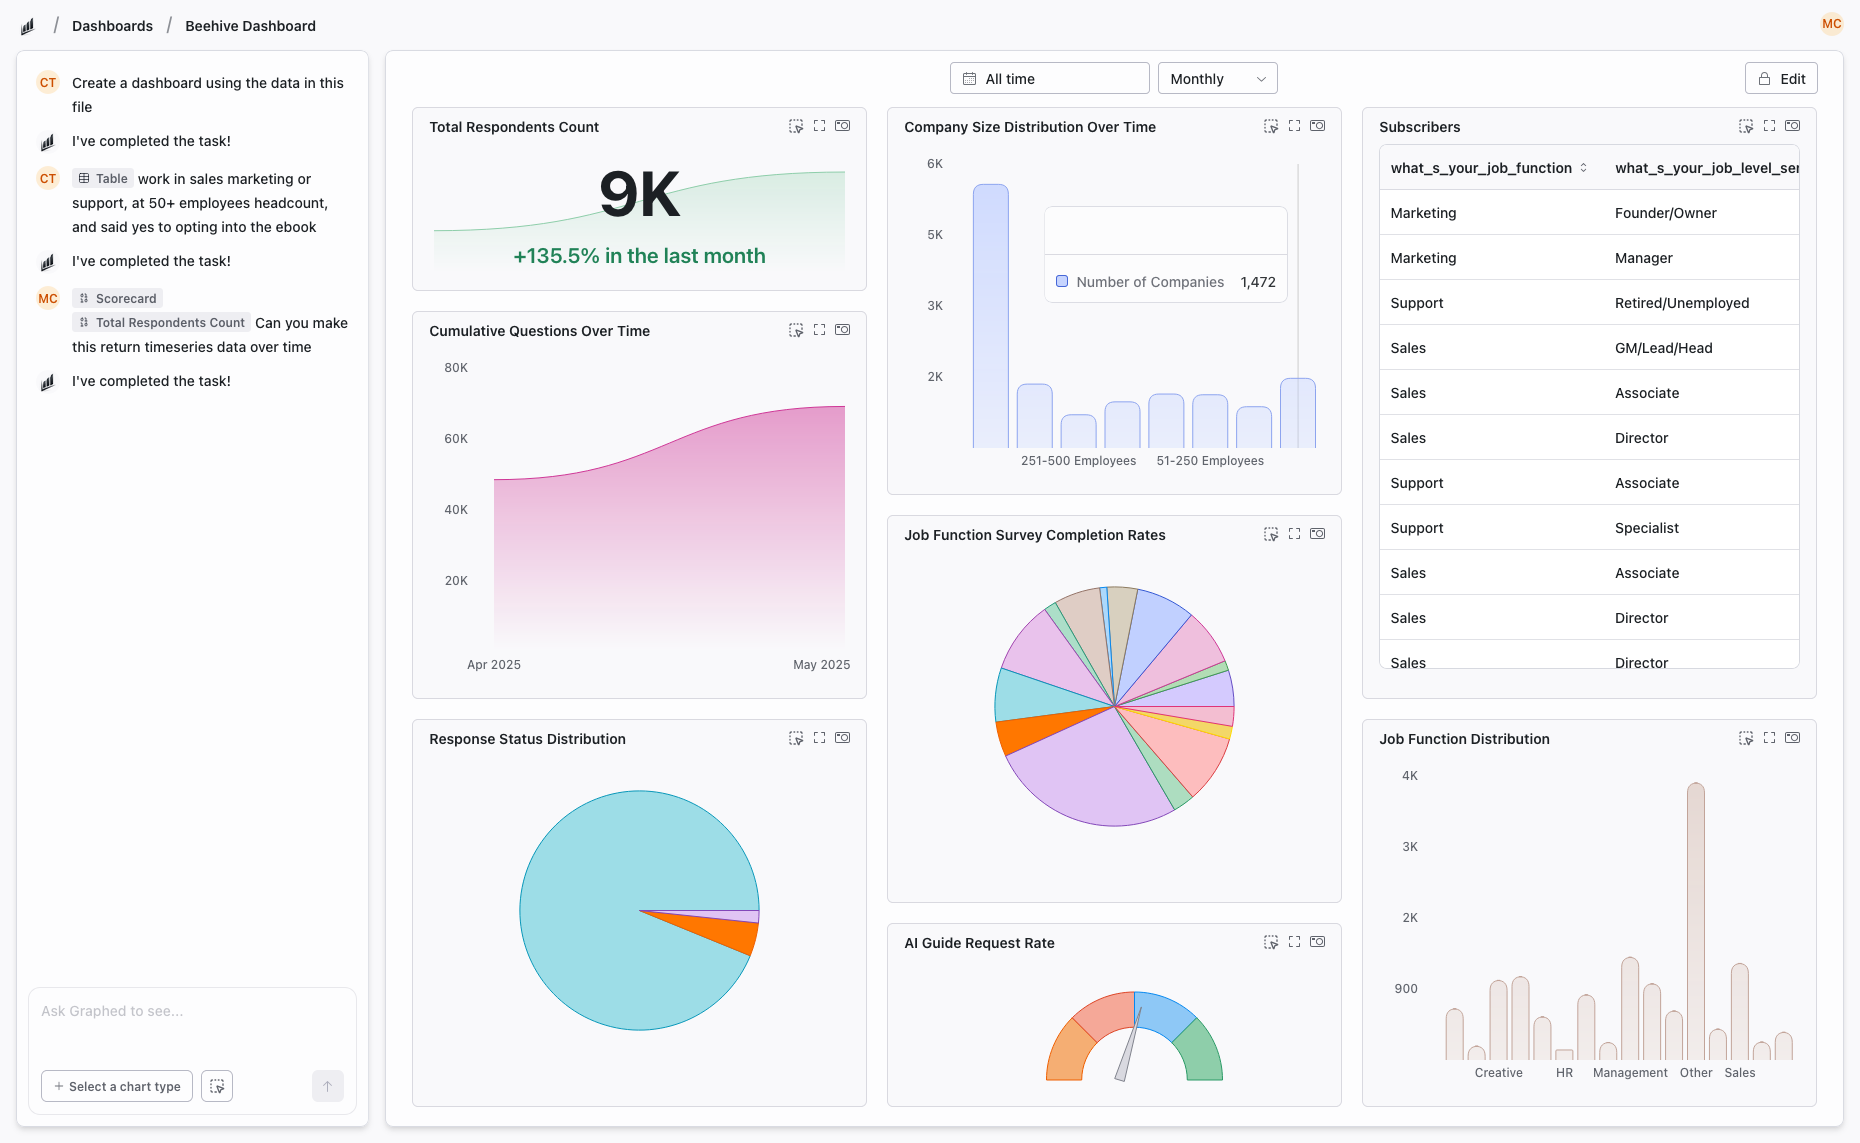
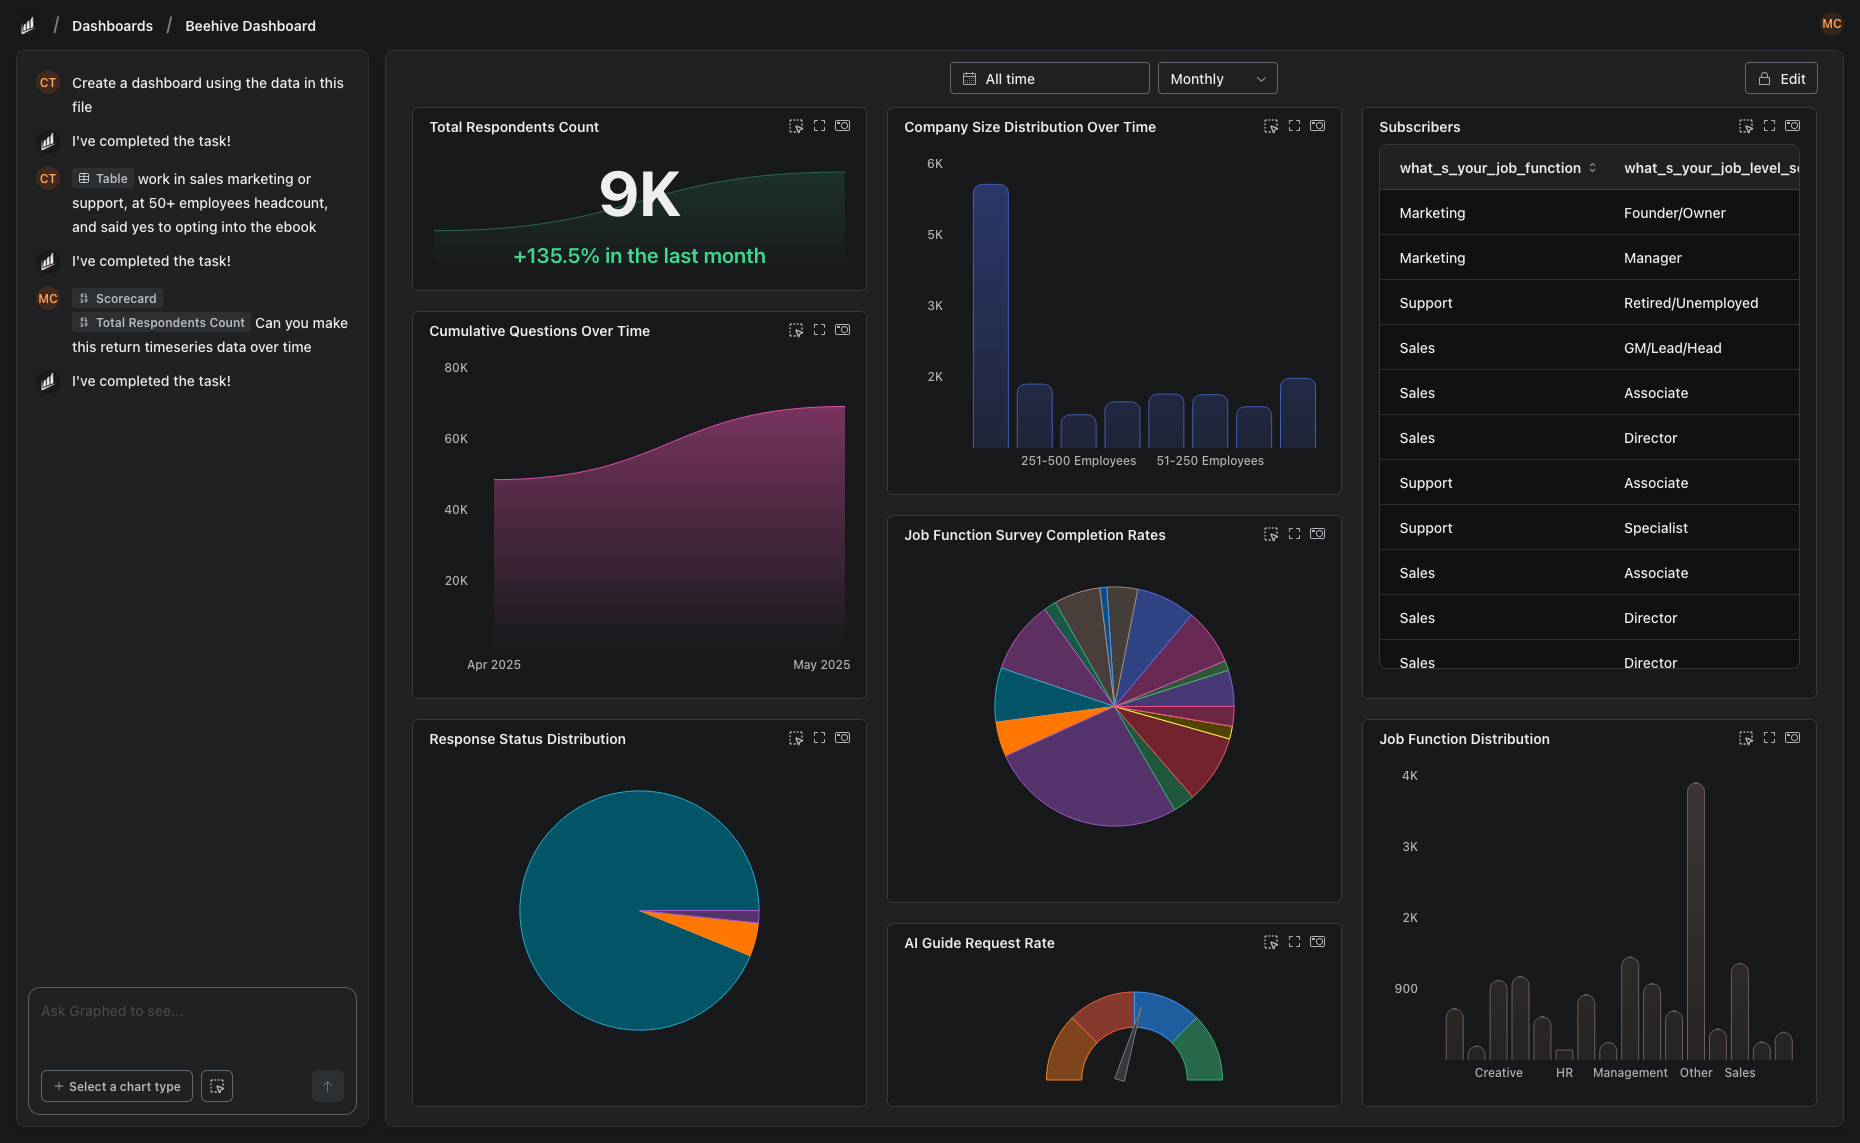
The biggest challenge is often the manual work - exporting CSVs, fighting with spreadsheets, and trying to connect your TikTok analytics to your actual business results in platforms like Shopify or HubSpot. We built Graphed to automate that entire process. You can instantly connect all your data sources and create live dashboards using simple, natural language. Instead of spending hours in spreadsheets, you can just ask, "Show my top 10 TikToks by average watch time last month," and get an answer in seconds, giving you more time to act on insights instead of just finding them.
Related Articles
Add-Ons for Google Analytics
Discover the best add-ons for Google Analytics to automate reporting and enhance data visualization. Simplify your analytics workflow effortlessly.
Looker Studio vs Metabase: Which BI Tool Actually Fits Your Team?
Looker Studio and Metabase both help you turn raw data into dashboards, but they take completely different approaches. This guide breaks down where each tool fits, what they are good at, and which one matches your actual workflow.
Looker Studio vs Grafana: Which Data Visualization Tool Is Right for You?
Looker Studio and Grafana are both free data visualization tools, but they solve very different problems. This guide breaks down how they differ, where each shines, and how to decide which fits your needs.