Google Data Studio vs BigQuery: Dashboard Builder vs Data Warehouse
Google Data Studio (now Looker Studio) and BigQuery are both Google Cloud products that serve different layers of the data stack. Data Studio builds dashboards. BigQuery stores and queries data. They are not alternatives — they are complementary.
Note: Google rebranded Data Studio to "Looker Studio" in October 2022.
Key Differences
Feature: What it is · Google Data Studio: Dashboard builder · BigQuery: Serverless data warehouse
Feature: Price · Google Data Studio: Free · BigQuery: $6.25/TB queried + $0.02/GB stored (free tier: 1TB/10GB)
Feature: Data handling · Google Data Studio: Connects to sources, caches data · BigQuery: Stores and queries petabytes
Feature: Interface · Google Data Studio: Drag-and-drop visual builder · BigQuery: SQL console
Feature: Visualization · Google Data Studio: Charts, scorecards, filters · BigQuery: Tables (raw query results)
Feature: ML/AI · Google Data Studio: Gemini (Pro only) · BigQuery: BigQuery ML (regression, forecasting, clustering)
Feature: Who uses it · Google Data Studio: Marketers, business users · BigQuery: Data engineers, analysts
How They Work Together
The standard Google Cloud analytics stack:
- Data sources (GA4, ads, CRM) → BigQuery (storage + SQL transformation) → Data Studio (dashboards)
BigQuery handles the heavy computation. Data Studio provides the visual layer. BigQuery eliminates Data Studio's performance issues by serving pre-aggregated tables that render instantly.
When You Need BigQuery
- Working with GA4 event-level data
- Joining 5+ data sources (bypasses Data Studio's blending limit)
- ML models (churn prediction, forecasting)
- Large datasets that slow Data Studio
When Data Studio Alone Is Enough
- Small datasets from 1-2 Google sources
- Simple marketing dashboards
- No SQL skills on the team
When Neither Is Enough
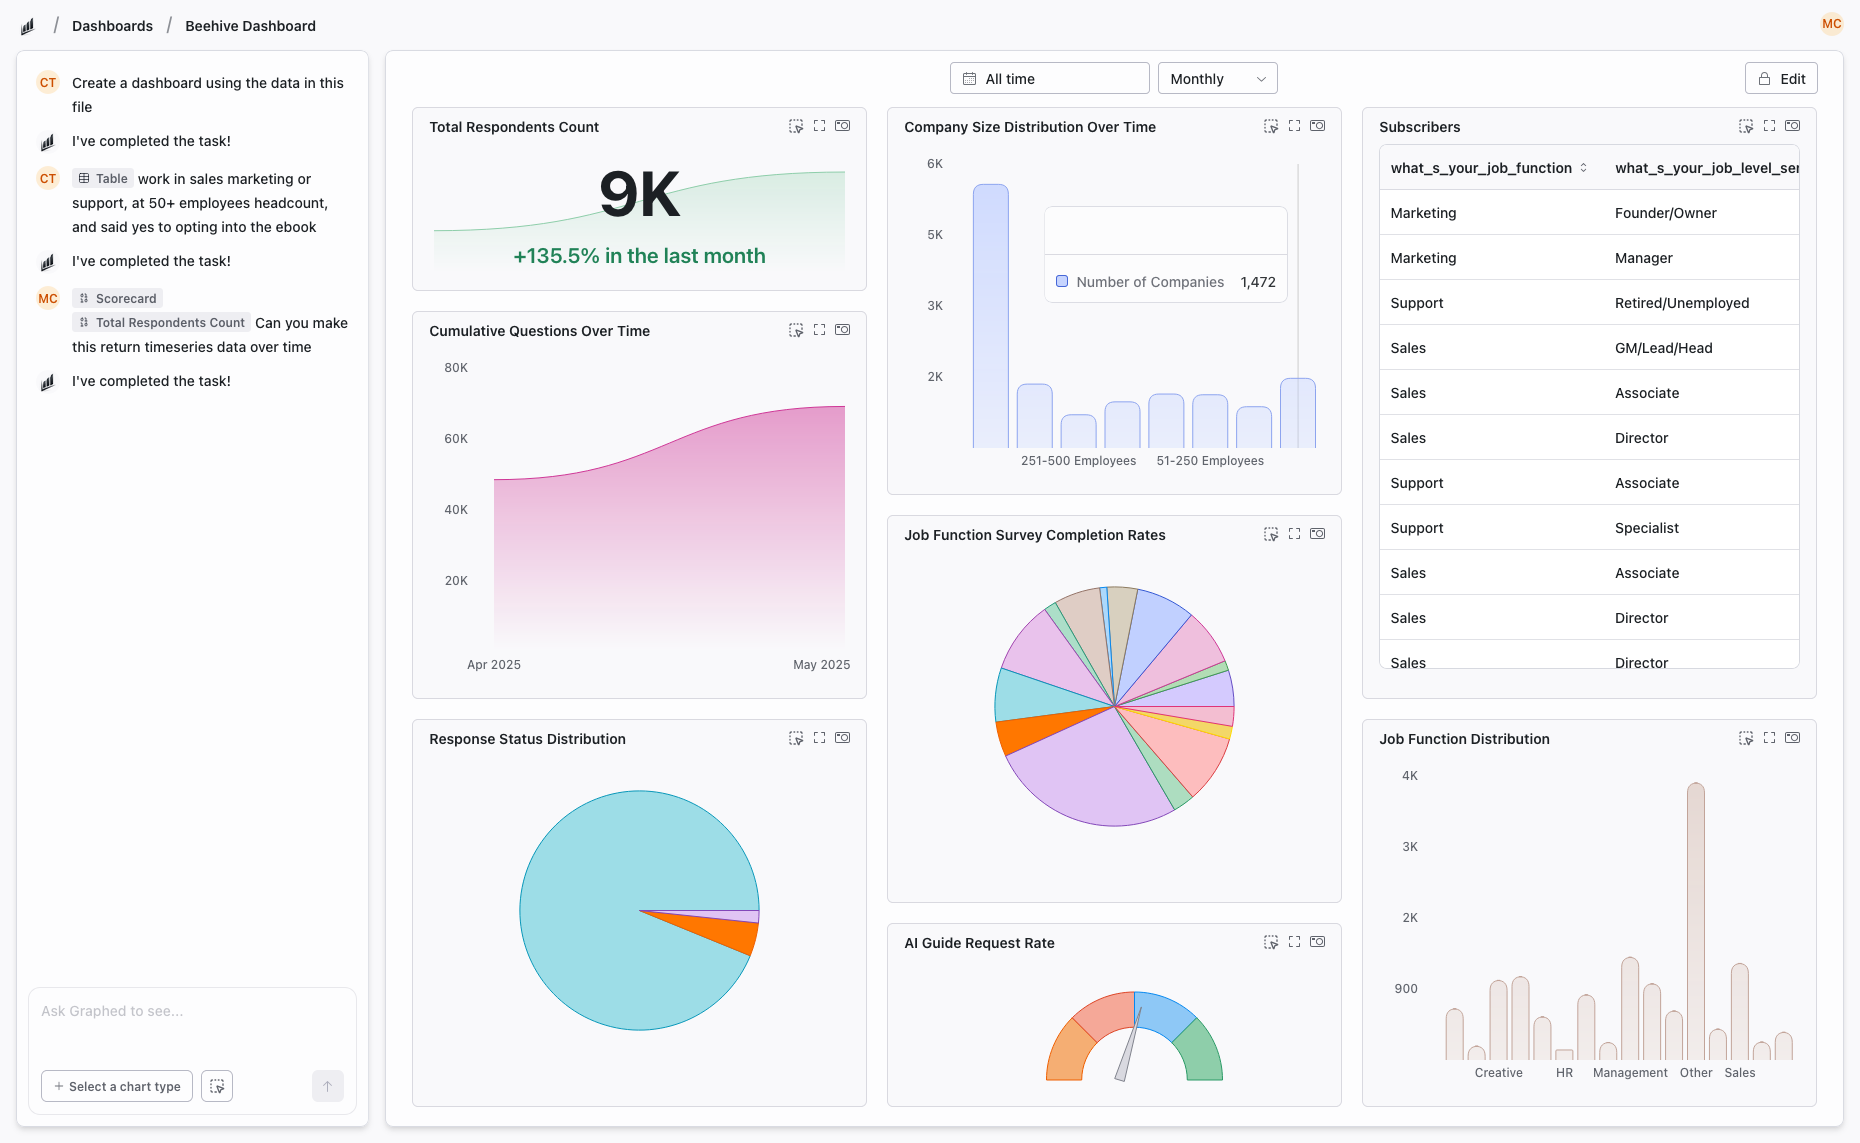
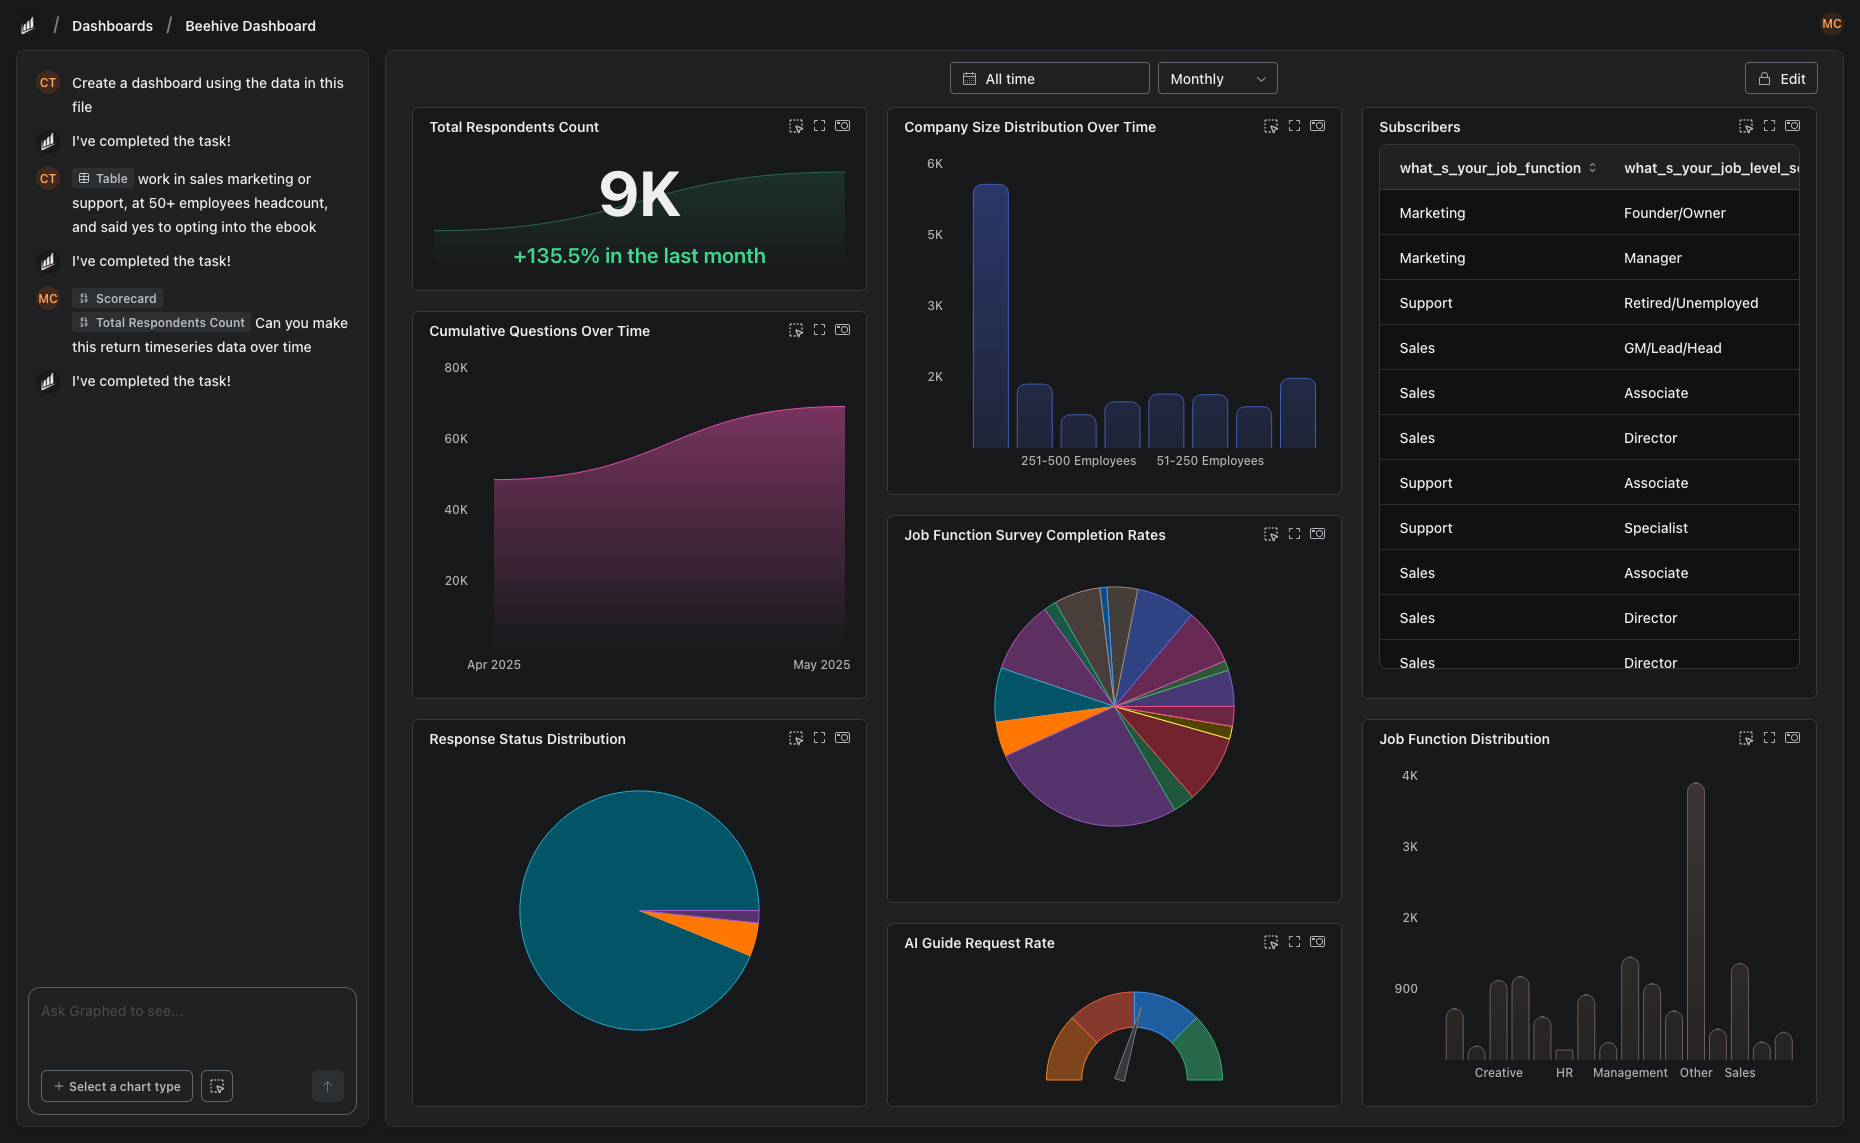
Building a BigQuery + Data Studio pipeline requires SQL skills, pipeline maintenance, and manual dashboard building. Graphed does all of this with AI — connects to 350+ sources, ingests into its own warehouse, and builds dashboards from natural language. No SQL. No drag-and-drop. Setup in 15 minutes.
The Bottom Line
BigQuery stores and processes data. Data Studio visualizes it. Most serious analytics setups use both. The question is whether building the pipeline between them is worth your team's time.
Related Articles
How to Create a Photo Album in Meta Business Suite
How to create a photo album in Meta Business Suite — step-by-step guide to organizing Facebook and Instagram photos into albums for your business page.
Is Google Analytics and Data Analytics the Same?
Is Google Analytics and data analytics the same? No — Google Analytics is one tool, data analytics is the broader discipline. Here is the difference.
What Database Does Tableau Use?
What database does Tableau use? Tableau connects to 100+ databases — it does not store data itself. Learn how live connections and extracts work.